
Traffic and sales are two different jobs, and most websites are only built for the first one. The campaign brings people to the page. What happens in the ten seconds after they land decides whether any of them become customers, and that part usually belongs to nobody. So the traffic chart climbs, the revenue line stays flat, and the argument that follows is about the ad account when the fault is sitting on the site.
Three causes account for most of it in our experience. The page loads slowly on a phone. The page does not say what the business does in words a stranger recognises. And the form or checkout at the end asks for more than it needs. None of the three appear in a traffic dashboard, which is why they survive for years inside businesses that are otherwise well run.
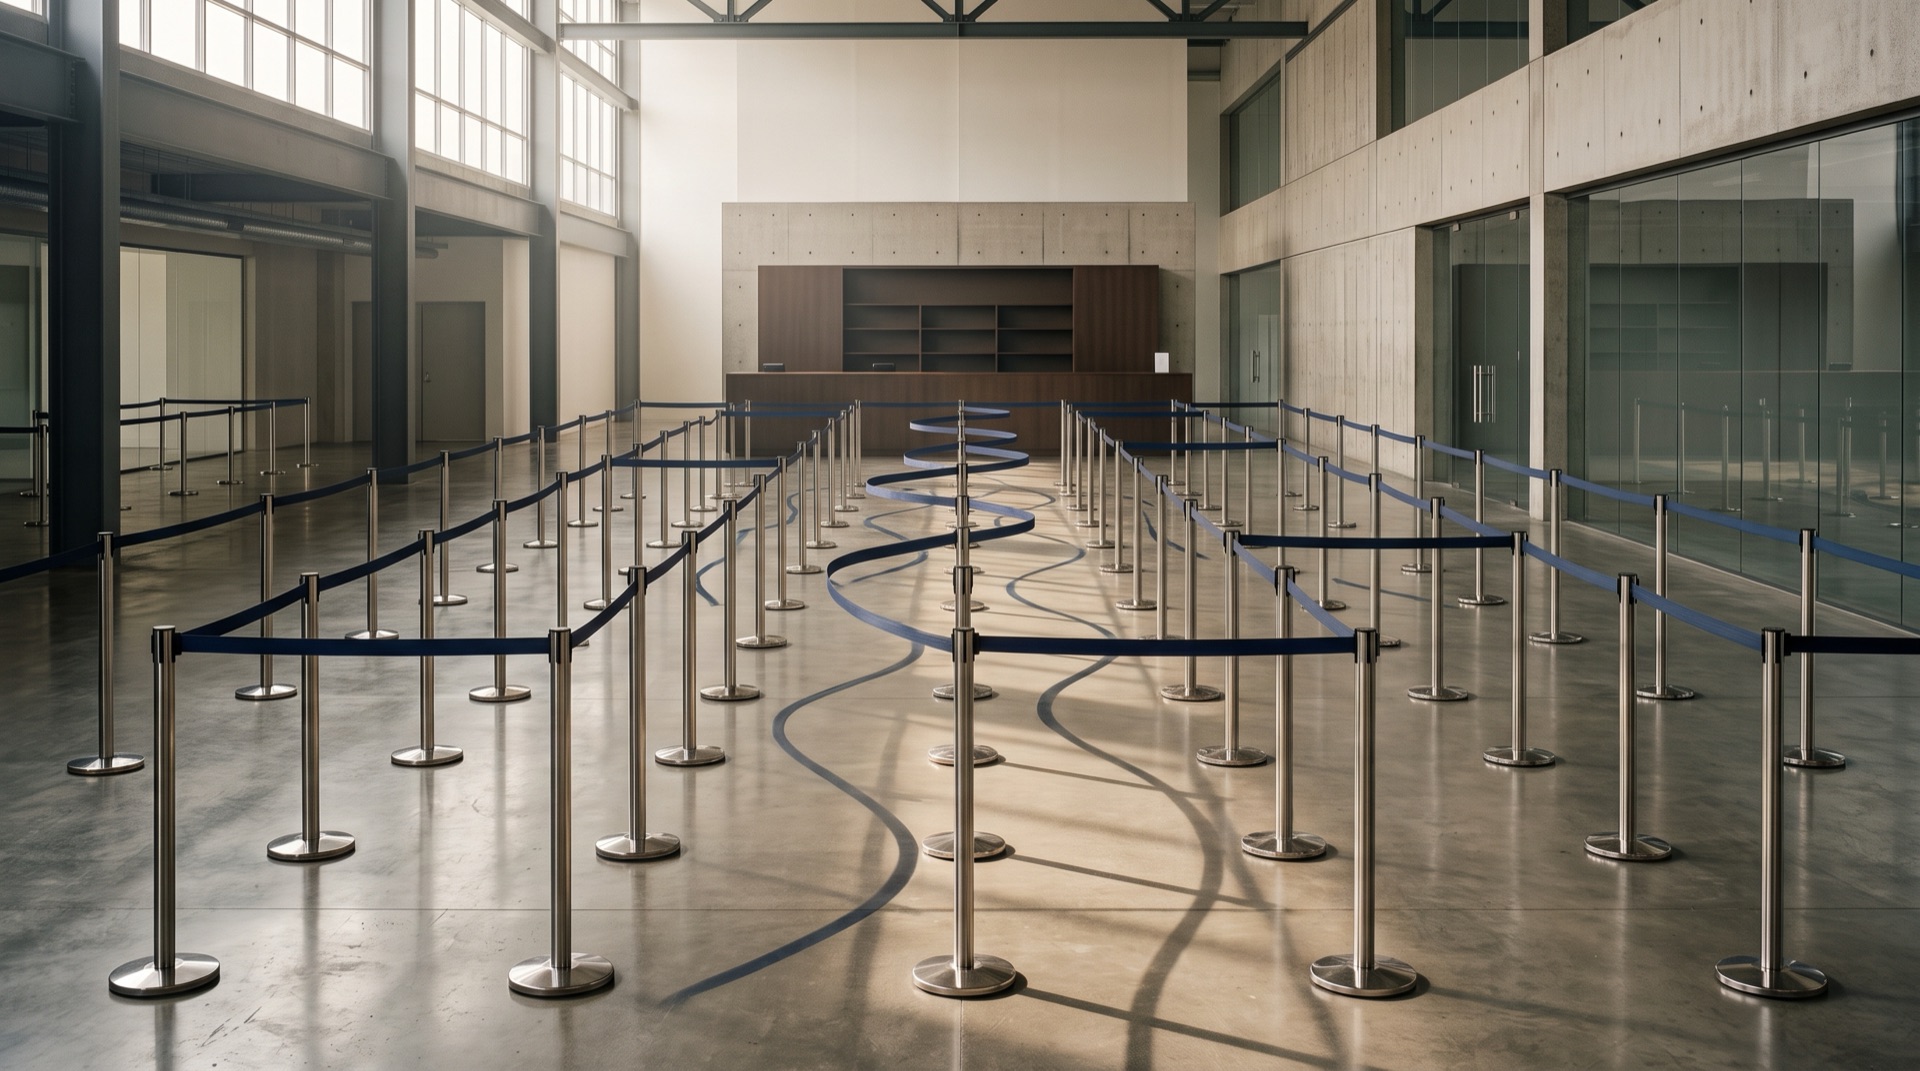
Why does more traffic stop producing more sales?
A conversion rate is not a fixed property of your business. It is what happens when one particular page meets one particular visitor, and when you buy more traffic you are usually buying visitors who sit further from a decision than the ones you had before. The first few hundred people who found you were searching your company name. The next ten thousand were scrolling past an ad.
That shift is normal and it is not a reason to stop spending. It does mean the site has taken on work it never had to do before. It now has to introduce the business to somebody who has never heard of it, in less time than that person is willing to give.
The money is moving online here. Malaysia recorded RM1,230.1 billion of e-commerce income in 2024, 3.9% up on the previous year according to the Department of Statistics Malaysia. Most of that total is business-to-business trade rather than consumer checkouts, so read it as evidence that online transactions are normal here, not as your addressable market.
How fast does your site need to be?
Fast enough that the main thing on the page appears within 2.5 seconds on a mid-range phone using mobile data. That is Google's own bar, and it is measured at the 75th percentile of your real visitors rather than on your laptop over office wifi.
| What Google measures | In plain terms | The "good" threshold |
|---|---|---|
| Largest Contentful Paint | Time until the main content shows up | 2.5 seconds or less |
| Interaction to Next Paint | Time the page takes to react to a tap | 200 milliseconds or less |
| Cumulative Layout Shift | How much the page jumps about while loading | 0.1 or less |
Those are the Core Web Vitals thresholds as they stand today. Miss them and you lose twice, because the same slowness that annoys the visitor also weakens the page in search.
The size of the commercial effect surprises people. Deloitte Digital, commissioned by Google, tracked mobile site data from 37 retail, travel, luxury and lead generation brands over four weeks and isolated what a 0.1 second improvement in load time did. Retail conversions rose 8.4% and average order value rose 9.2%. Travel conversions rose 10.1%. On lead generation pages, bounce rate improved by 8.3%. A tenth of a second.
Work in the other direction and the picture is the same. Google's mobile benchmark research found the probability of a bounce climbs 32% as load time goes from one second to three, and 123% as it goes from one second to ten.
Most Malaysian sites we audit fail on the same things: uncompressed hero images shot at print resolution, a stack of tracking scripts nobody has reviewed since 2023, and a page builder theme carrying twenty features the site does not use. Fixing those is a week of work, not a rebuild.
Does your page answer the question in ten seconds?
Speed only buys you the chance to be read. What happens next is a much shorter interview than most business owners imagine.
Nielsen Norman Group analysed browser data covering 205,873 web pages, gathered by Microsoft Research across more than two billion page visits. The pattern they found is called negative aging: people are most likely to leave in the first ten seconds, and if they get past roughly thirty seconds they tend to stay for two minutes or more. The average page visit lasts a little under a minute. Everything hangs on the opening.
So a stranger landing on your homepage needs four answers before they will give you the thirty seconds. What do you sell. Who is it for. Why you rather than the other tab they have open. What do they do next. Read your own homepage as somebody who has never met you, and count how many of the four you can answer above the fold.
The usual failure is a headline written for people who already know the company. "Partnering with brands to unlock their potential" answers none of the four. "We run Meta and Google ads for Malaysian businesses spending RM20,000 a month or more" answers three of them in one line and disqualifies the wrong reader on purpose, which is a feature.
Where does the money leak at the checkout?
If you sell online, the leak has a documented size. Baymard Institute keeps a running average across 50 separate studies and puts documented cart abandonment at 70.22%. Seven in ten people who put something in a basket walk away from it.
A good share of that is browsing behaviour you cannot fix. The rest is your checkout, and the reasons people give are consistent enough to work through as a list.
Read the top bar again. The single largest cause of abandoned baskets is a cost the shopper did not see coming. Shipping added at the last step, a payment fee, tax appearing after they committed. The fix costs nothing: state delivery cost on the product page, or set a free-shipping threshold and put it in the header.
Length is the other quiet tax. Baymard's benchmark found the average US checkout in 2024 asked for 11.3 form fields when 8 will do. Every extra field is another chance for somebody on a phone, on the LRT, to decide this can wait until later. Later does not come.
What if you sell by enquiry rather than by cart?
Then your checkout is the enquiry form and the phone call after it, and the same rules apply with one addition: speed after the form matters as much as speed before it.
The most-cited work here is the Lead Response Management study run by Dr James Oldroyd at MIT Sloan with InsideSales, covering more than 15,000 leads and 100,000 call attempts. Letting a web enquiry sit from five minutes to thirty minutes cut the odds of qualifying that lead by a factor of 21. The study is from 2007 and the exact multiplier will not survive translation to your business in 2026, so treat the direction as the finding: the first hour does most of the work, and the enquiry you answer tomorrow is usually somebody else's customer today.
Three things we change most often on Malaysian enquiry sites. The phone number goes back into the header, because a large share of buyers here would rather WhatsApp than fill anything in. The form drops to name, contact and one qualifying question. And somebody owns the inbox with a named response time, which is an operations decision rather than a marketing one.
If your enquiries arrive but never progress, the problem may sit further upstream than the website. We worked through that case separately in why your cheap leads never convert.
Fix these five first
Test your own site on your own phone, on mobile data, at 6pm. Not on office wifi, not on a desktop. Run the page through PageSpeed Insights and read the field data section, which reports what real visitors experienced rather than what a lab simulation predicts.
Compress every image above the fold. A hero image has no business being 3 MB. A few hundred kilobytes renders identically on a phone screen and often removes half your load time on its own.
Rewrite the first screen for a stranger. Answer what you sell, who it is for, why you and what happens next, in that order, in plain language. Delete any headline that would still make sense pasted onto a competitor's site.
Show the full price before the last step. Delivery, fees and tax. Whatever the number is, the shopper finds out eventually, and the cheapest moment to tell them is the earliest one.
Cut your form to the fields you will use this week. Anything the sales team can ask on the call comes off the form. Count the fields before and after, because the count is the metric.
Frequently asked questions
What is a good website conversion rate in Malaysia?
There is no credible single number, and any agency quoting you one has picked it off a blog. The rate depends on price point, traffic source, industry and whether you sell online or by enquiry. Use your own site's last six months as the benchmark and compete against that. What matters is the direction after a change, measured over enough weeks to mean something.
Should I redesign the whole site or fix the pages I have?
Fix first, almost always. Speed, first-screen clarity and form length are cheap to change and you learn what moved the number. A full redesign resets everything at once and leaves you unable to say which decision helped. We set out what a rebuild costs in how much a website costs in Malaysia if the fixes will not carry you.
How long before conversion changes show up in revenue?
Speed and checkout fixes show up within days on a site with reasonable traffic volume, because they act on people already arriving. Clarity and positioning changes take longer to read, since they alter who bothers to enquire in the first place. Give any single change at least four weeks before you judge it, and longer if your traffic is thin.
Does page speed still affect Google rankings?
Yes, though it is one signal among many rather than a lever on its own. The stronger argument for fixing it is commercial: the Deloitte figures above are conversion effects, and they apply whether or not your ranking moves.
My traffic is up but my enquiries are flat. Where do I look first?
Segment the traffic by source before you touch the site. A jump driven by a new channel, a broad-targeted campaign or an unrelated blog post will lower your average conversion rate without anything on the site getting worse. If the mix is unchanged and the rate has fallen, then the site is the place to look. We covered the reporting side of this in how to measure marketing ROI beyond ROAS.
Is a landing page better than sending ad traffic to the homepage?
For a specific offer, usually yes, because the page can answer the exact question the ad raised. A homepage has to serve every visitor at once and ends up serving none of them well. Keep the homepage for people arriving by search and brand, and build dedicated pages for campaigns.
The bottom line
You have already paid for the visitors. That is the part worth sitting with, because a conversion problem is money leaving a bucket you have filled at full price, and the repairs are cheaper than the next month of media. Load time, the first screen, the length of the form. Three fixes, none of them a rebuild, all of them measurable within a quarter.
If your traffic is growing and your revenue is not, talk to us and we will audit the pages your ads land on before we talk about anything else. You can also see how our website design team builds pages around the enquiry rather than around the gallery, or work out what your ads need to return with the break-even ROAS calculator.